


TL;DR
- Mobile app analytics connects acquisition, product use, monetization, quality, and retention signals.
- Apple, Google Play, and product analytics each answer different parts of the same customer journey.
- A purchase attempt does not prove that a customer received access or renewed successfully.
- Keep voluntary cancellations separate from failed renewals before diagnosing churn.
- Compare the same metric definition and cohort over time before acting on a change.
Mobile app analytics is how an app team works out what happened after a number moves. Installs can rise while paid access stays flat. A paywall can convert while renewals slip. A release can look healthy until crash reports and support tickets show a different story.
The job is bigger than one dashboard. Store reporting, product events, billing state, and support contacts each hold part of the customer journey. The useful work starts when those pieces answer one question together.
What does mobile app analytics cover?
Mobile app analytics covers the journey from discovery to ongoing use. Apple groups its App Store Connect performance metrics across discovery, downloads, sales, usage, in-app events, subscriptions, and crashes. Product analytics adds the actions that happened inside the app. Support adds the parts customers could not complete or understand.
| Area | The question it answers | Useful signals |
|---|---|---|
| Acquisition | How did people find the app? | impressions, product-page views, downloads, source or campaign |
| Activation and use | Did they reach the first useful moment? | onboarding completion, feature use, sessions, return activity |
| Monetization | Did an offer turn into access? | paywall view, purchase attempt, transaction result, entitlement grant |
| Subscription state | Did recurring access continue? | trial start, renewal, cancellation, billing issue, expiry |
| Quality and support | Did the app work and make sense? | crashes, failed flows, tickets, restore attempts |
The columns belong together. A fall in sessions can be a product problem, a crash problem, a billing lockout, or a change in who arrived. The headline number tells you where to look. The surrounding events tell you what to fix.
Which systems hold the signals?
There is no single native dashboard for the whole journey. Start with the systems already attached to the app and be clear about the limits of each one.
Apple’s App Analytics reports acquisition, usage, retention, crashes, and peer benchmarks. Apple also notes that usage data is limited to people who agreed to share diagnostics and usage information. Treat that as a defined measurement set, not a census of everyone who installed.
Google Play’s billing documentation covers the transaction layer for digital products and subscriptions. Product-event tools such as Google Analytics for Firebase measure app usage and engagement. Firebase supports automatically collected, recommended, and custom events, but event names only become useful after the team agrees what each one means.
| System | Strongest use | What it cannot settle alone |
|---|---|---|
| Store reporting | discovery, download, transaction, subscription, and quality context | the product behavior that led to a decision |
| Product analytics | screens, actions, activation, and feature use | whether the store granted or renewed access |
| Billing or entitlement service | current purchase and access state | why a customer never reached the purchase or became confused |
| Support system | questions and broken handoffs in the customer’s words | the size of the affected segment without the other event data |
A dashboard becomes misleading when it claims an answer that belongs to another system. A completed checkout is not proof of access. A cancel event is not proof of a product complaint. A ticket is not proof that every customer hit the same issue.
What should be in a weekly view?
A weekly mobile app analytics review does not need every event in the warehouse. It needs enough context to explain a meaningful movement.
Keep one view for the customer journey:
- Acquisition: store impressions, product-page views, downloads, and the source where available.
- First value: onboarding completion and the product action that shows the app became useful.
- Monetization: paywall views, purchase attempts, transaction results, and entitlement grants.
- Retention: return activity, renewal state, voluntary cancellations, failed renewals, and expiry.
- Quality: crashes, failed actions, restore attempts, and support contacts after a key event.
The events should use a stable customer or account key wherever that is appropriate and permitted. Without a way to relate the product event to the subscription event, an operator may see a revenue dip without knowing whether customers hit a broken screen, rejected an offer, or lost access after paying.
For the transaction and entitlement side, see what in-app purchases are. If the question is whether the business model itself fits the value being sold, start with app monetization. For the operating work of turning those signals into return visits, see how to increase app retention.
Where do app analytics investigations go wrong?
The hard part is usually a category mistake. The team asks a behavior event to explain a store state, or treats two different forms of churn as one loss.
| Mistake | What it hides | Better cut |
|---|---|---|
| Counting checkout as success | customers who paid but did not receive access | transaction result next to entitlement state |
| Combining cancels and failed renewals | a billing issue that gets sent to product work | voluntary cancellation and billing loss as separate states |
| Comparing different cohorts | a mix shift that looks like a product improvement | the same cohort, plan, and time window |
| Treating opt-in usage data as all users | a measurement boundary in store usage reporting | the source definition next to the trend |
| Reading a crash rate without the release context | a release-specific failure that gets averaged away | version, device, and journey stage |
The split between voluntary and failed-payment loss deserves care. Apple reports Billing Issue and Canceled as distinct reasons. A customer who chose to leave needs a different investigation from one whose renewal did not collect. Churn analysis shows how to work that split before assigning a fix.
How do you investigate a movement?
Start with a scene, not a dashboard tour. Say renewal fell for annual subscribers after a release, or purchase attempts rose while entitlement grants did not. Then follow the customer path in order.
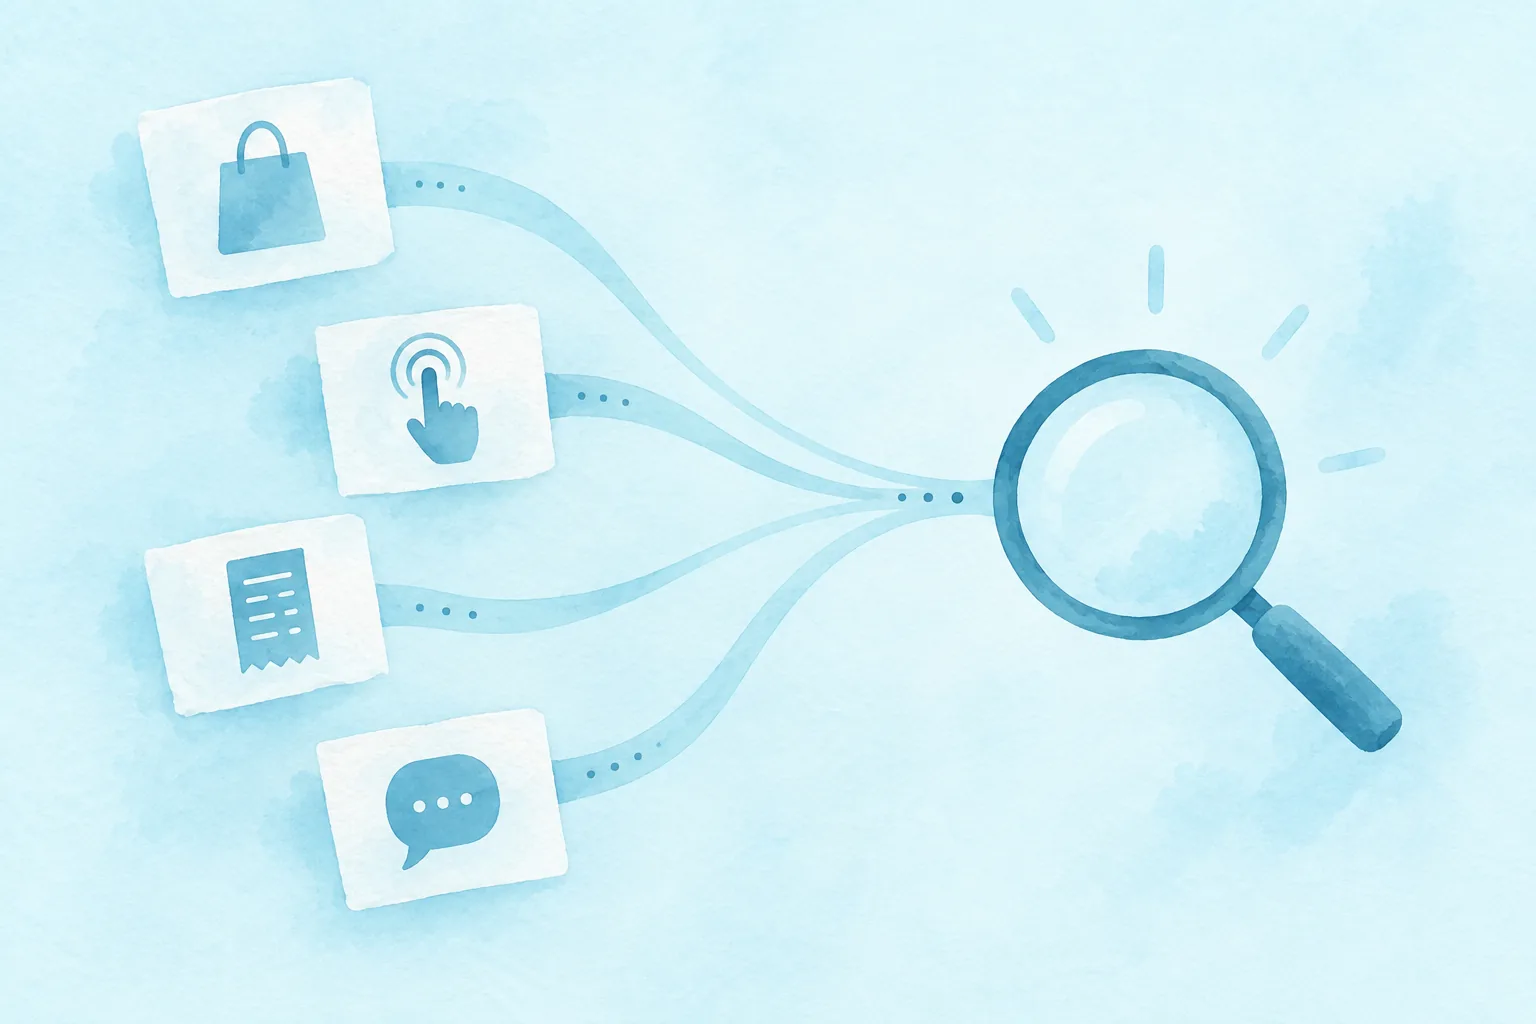
- Define the movement and the segment. Keep the cohort, plan, platform, and time window explicit.
- Check the closest source of truth. For a renewal question, begin with subscription state. For a crash question, begin with the affected version and journey stage.
- Read the neighboring product behavior. Did people reach the screen, attempt the action, or return after the event?
- Read support contacts from the same period for language that points to a broken handoff.
- Pick one owner and one small change. Then check the same cut again after the change has had time to register.
This avoids the familiar move where every metric gets put on a board and nobody knows what to do next. The aim is not a larger report. It is a shorter path from a changed number to a responsible next action.
A mobile app analytics checklist
Before adding another event, check whether the existing data can answer these questions:
- Can we distinguish a purchase attempt from a completed transaction and an entitlement grant?
- Can we separate a voluntary cancellation from a failed renewal?
- Do we know which release, plan, platform, and cohort the change belongs to?
- Are store metric definitions and opt-in boundaries visible to the person reading the trend?
- Can a support contact be read next to the event that prompted it?
- Does each review end with one owner and one change rather than a long list of possible causes?
The useful mobile app analytics setup is the one that lets a tired operator trace a movement back to the customer moment behind it.
For the operating plan that turns those signals into return visits, see app engagement strategy. Store feedback belongs beside those signals. App review management explains how to route and reply to the feedback, while rating prompts covers the narrow moment when an app asks for it.
See how Refix connects product, subscription, and support signals.
FAQ
- What is mobile app analytics?
- Mobile app analytics is the practice of measuring how people discover, use, pay for, and leave an app. It combines store data, product events, subscription state, quality signals, and support context so a team can investigate what changed.
- What metrics should mobile app analytics include?
- A useful view includes acquisition and store conversion, activation and product use, purchase and entitlement state, subscription renewals and cancellations, crashes, and support contacts. The right cut depends on the question, but the definitions should stay consistent over time.
- What is the difference between mobile app analytics and product analytics?
- Product analytics usually explains behavior inside the app, such as screens viewed or features used. Mobile app analytics also includes store discovery, transaction and subscription state, quality signals, and the context around a customer who needs help.
- How do app teams use mobile app analytics?
- Start with one movement, such as a fall in renewal or a rise in crashes. Check the store or billing event, the product behavior around it, and the relevant support context. Then assign one owner to the smallest useful change and review the same segment again.