


TL;DR
- Revenue churn counts recurring revenue lost in a period; customer churn counts customers lost.
- The two diverge whenever plan values differ, so track both from the same cohort.
- Gross revenue churn excludes expansion; net revenue churn subtracts it and can go negative.
- Voluntary cancels, downgrades, and failed renewals all feed revenue churn but need different fixes.
- Reduce revenue churn by routing each movement to product, plan, or payment-recovery work and measuring per cohort.
Revenue churn answers the question a customer count cannot: how much recurring money left. An app can lose a tenth of its subscribers and barely feel it, or lose a handful and miss the month. The difference sits entirely in which plans those customers held.
Customer churn counts the people who left. Revenue churn counts the dollars that left with them. Both numbers matter, and they point at different fixes.
What is revenue churn?
Revenue churn is the share of recurring revenue an existing customer group stops paying over a period. Cancellations pull it up, and so do downgrades to cheaper plans. New customers never enter the math. The metric isolates what happened to money you already had.
For most app teams the gross figure is the starting point:
Revenue churn rate = (revenue lost to cancellations + revenue lost to downgrades) / starting recurring revenue x 100
Read it against the same starting cohort you use elsewhere, usually the subscribers active at the beginning of a month or quarter. A rate of 4 percent means four cents of every starting dollar stopped recurring. Churn analysis is the companion guide for splitting that loss into voluntary cancellation and failed-payment parts before acting on it.
How is revenue churn different from customer churn?
Customer churn divides customers lost by customers at the start. Revenue churn divides dollars lost by dollars at the start. The formulas look like twins until plan values differ, and in a catalog with more than one tier they usually do.
| Customer churn | Revenue churn | |
|---|---|---|
| Counts | Subscribers lost | Recurring revenue lost |
| Denominator | Starting subscriber count | Starting recurring revenue |
| Downgrades | Ignored until the customer leaves | Counted as contraction immediately |
| Moves most when | Many low-price subscribers leave | A few high-price subscribers leave or downgrade |
The numbers below are a simple illustration to show the arithmetic, not a report of any real app or Refix customer. Imagine a subscription app starts the month with 400 subscribers paying 8,000 dollars in total. During the month, 40 subscribers on a 5 dollar plan cancel and 2 subscribers on a 100 dollar plan cancel.
Customer churn is 42 lost out of 400, or 10.5 percent. Revenue churn is 400 dollars lost out of 8,000, or 5 percent. The customer number looks alarming; the revenue number says the damage sits in the low tier. Flip the mix, two enterprise cancellations instead of forty basic ones, and the revenue figure screams while the customer count barely moves. That flip is why pricing and packaging owners care about this metric more than any other churn number.
What makes revenue churn go up?
Three drivers feed the number, and each belongs to a different owner.
Voluntary cancellation by high-value subscribers moves it fastest. One annual plan that does not renew can outweigh dozens of monthly cancels. When this segment moves, the questions sit with product and packaging: did these subscribers reach the paid outcome, does the tier still fit how they use the app, and did a price or plan change reset their expectations. Apple’s report labels help sort this group: its cancellation reasons reference keeps Canceled apart from Billing Issue, so a deliberate cancel is never mixed with a card that did not collect. Subscription cancellation reasons explains each label and how the store taxonomy differs from an in-app survey.
Contraction moves revenue churn without touching customer churn at all. A family plan dropping to a basic tier, an annual subscriber switching to monthly, a seat count shrinking: nobody left, yet fewer dollars recur. Because the customer count holds steady, teams watching only customer churn miss this leak for months. Plan-fit work, clearer tier boundaries, and upgrade paths that match real usage sit here.
Failed renewals move it from the billing side. The subscriber did not choose to leave; the collection did not complete. Stripe’s revenue recovery documentation describes the standard card-billing response: retry the payment automatically with Smart Retries, watch failure and recovery rates in recovery analytics, email customers when a payment fails or a card expires, and keep card details current with automatic card updates. App Store billing runs on Apple’s own recovery states instead, including Billing Grace Period, which failed payment recovery for subscription apps covers in detail. Either way the fix is operational, not motivational: no discount persuades an expired card.
Should you track gross or net revenue churn?
Gross revenue churn counts only what left. Net revenue churn subtracts what existing customers added through upgrades and add-ons, so it can fall to zero or below when expansion covers the loss. Both derive from the same starting revenue; the difference is whether expansion enters the math.
Net revenue churn = (lost revenue - expansion revenue) / starting recurring revenue x 100
A negative net figure means the starting cohort pays more than before, even after the departures. That sounds comfortable, and it can hide a shaky base when a few large upgrades cover broad downgrade pressure. Track the gross number beside it. Gross vs net retention walks through the same pair from the retention side with worked formulas, and net retention rate gives the full NRR treatment including contraction.
Because churn feeds directly into lifetime value math, the revenue figure also sharpens forecasting. Customer lifetime value calculator shows how average revenue per customer and churn combine into a CLV estimate, and that estimate only holds when the churn input reflects revenue reality rather than a blended customer count.
How do you reduce revenue churn?
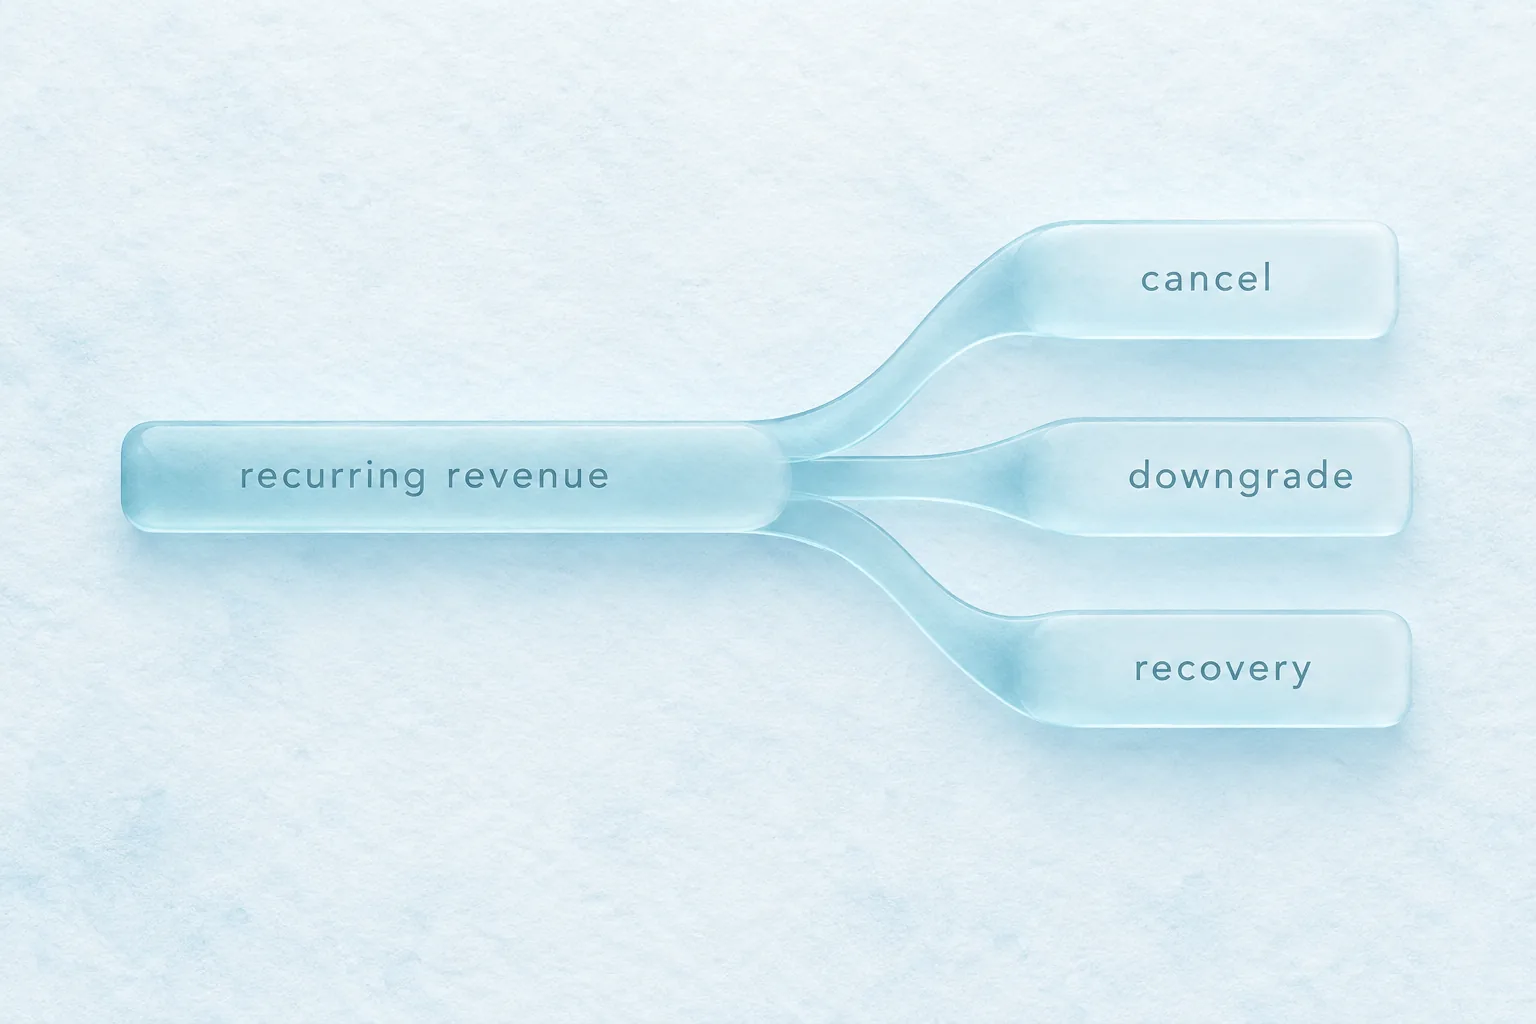
Start where every churn review should start: split the movement before choosing the fix. Reduce churn is the action guide for that routing work, and its first rule applies here with extra force. A revenue spike caused by failed renewals needs payment recovery, while one caused by annual-plan cancels needs product or packaging work. One blended response serves neither.
A practical sequence for the team:
- Name the cohort, plans, and period behind the movement.
- Split the lost revenue into voluntary cancels, downgrades, and failed renewals.
- Weight each part by revenue, not by customer count, so the largest dollar leak gets the owner.
- Assign one change per part: plan fit or recurring value for cancels, tier boundaries for contraction, recovery states and payment-update paths for failed renewals.
- Compare the next eligible cohort with the same definitions, keeping revenue churn beside customer churn in the report.
Since high-value segments carry the most weight in this metric, look at them first when the number jumps. A handful of interviews or support threads from the plan tier that moved usually says more than a dashboard-wide average.
Refix is built to connect product, subscription, and support signals, so a revenue-churn movement can be traced from the lost dollars back to the cohort, plan, and last subscriber state behind them.
See how Refix connects the signals behind retention work.
FAQ
- What is revenue churn?
- Revenue churn is the share of recurring revenue lost from an existing customer group over a period through cancellations and downgrades. It is usually expressed as a percentage of starting recurring revenue.
- How do you calculate revenue churn?
- Divide the recurring revenue lost to cancellations and downgrades by the starting recurring revenue, then multiply by 100. Leave expansion out for gross revenue churn; subtract expansion revenue for the net figure.
- What is the difference between revenue churn and customer churn?
- Customer churn counts the share of customers lost. Revenue churn counts the share of recurring revenue lost. Losing many low-price customers moves customer churn more, while losing a few high-price customers moves revenue churn more.
- What is gross vs net revenue churn?
- Gross revenue churn counts only lost revenue from cancellations and downgrades. Net revenue churn also subtracts expansion from upgrades, so it shows whether growth from existing customers offset the loss.
- What is a good revenue churn rate?
- There is no single number that fits every app, since price, plan mix, and billing mix differ. Compare the rate against your own trend for the same cohort definition and investigate sharp movements by segment.
- How do you reduce revenue churn?
- Separate voluntary cancellations from failed renewals first. Work plan fit and recurring value for cancels, downgrade paths for contraction, and the platform payment-recovery states for failed renewals, then measure each change by cohort.