


TL;DR
- Churn analysis explains why subscribers left, while a churn rate only reports how many left.
- Voluntary churn and involuntary churn need separate analysis because the fixes are different.
- Segment churn by cohort, plan, and lifecycle stage before deciding what to change.
- Apple's cancellation reasons report shows Billing Issue, price events, Canceled, Removed From Sale, and Other.
- In-app survey answers sit under Canceled and describe only part of voluntary churn.
- Each finding should point to one owner and one next change to test.
A churn number tells you how many subscribers left. It does not tell you why they left, or what would have kept them. That gap is the whole job of churn analysis.
Picture the moment: a monthly report shows churn went up two points. Nobody in the meeting can say whether more people chose to cancel, or more renewals failed on bad cards. One of those is a product problem. The other is a billing problem. Until the number is split apart, the team is guessing.
What is churn analysis?
Churn analysis is the process of breaking subscriber loss into causes a team can act on. The churn rate counts the leavers. The analysis sorts them into groups: people who chose to leave, people whose payment failed, and the cohorts, plans, and lifecycle stages where the loss concentrates.
This matters because each group needs a different response. A confusing onboarding flow, a price rise, and an expired card all show up as the same lost subscriber in a top line number. Treat them as one problem and the fix misses at least two of the three.
For subscription apps, churn analysis is diagnosis work. It starts when the rate moves and ends when each part of the loss has a named cause and an owner.
How do you analyze churn?
Start with the simplest split, then add one layer at a time. Resist the urge to build a model before you can answer the basic question: did these subscribers cancel, or did their renewal fail?
A practical order looks like this:
- Separate voluntary cancels from failed-payment loss.
- Segment each side by cohort, plan, and lifecycle stage.
- Read the reasons behind the voluntary cancels.
- Check what billing recovery already saved on the involuntary side.
- Turn each finding into one owned change.
Each step narrows the question. The first step tells you which playbook to open. The later steps tell you where inside that playbook to work. Start with the segment showing the clearest change, so the follow-up work stays small enough to ship.
Voluntary vs involuntary churn
Voluntary churn means the subscriber chose to leave. They opened Subscriptions, tapped Cancel, and the subscription stopped renewing at the end of the period. Involuntary churn means the subscriber lost access even though they never cancelled. The renewal charge did not collect, the retry window ran out, and the subscription expired.
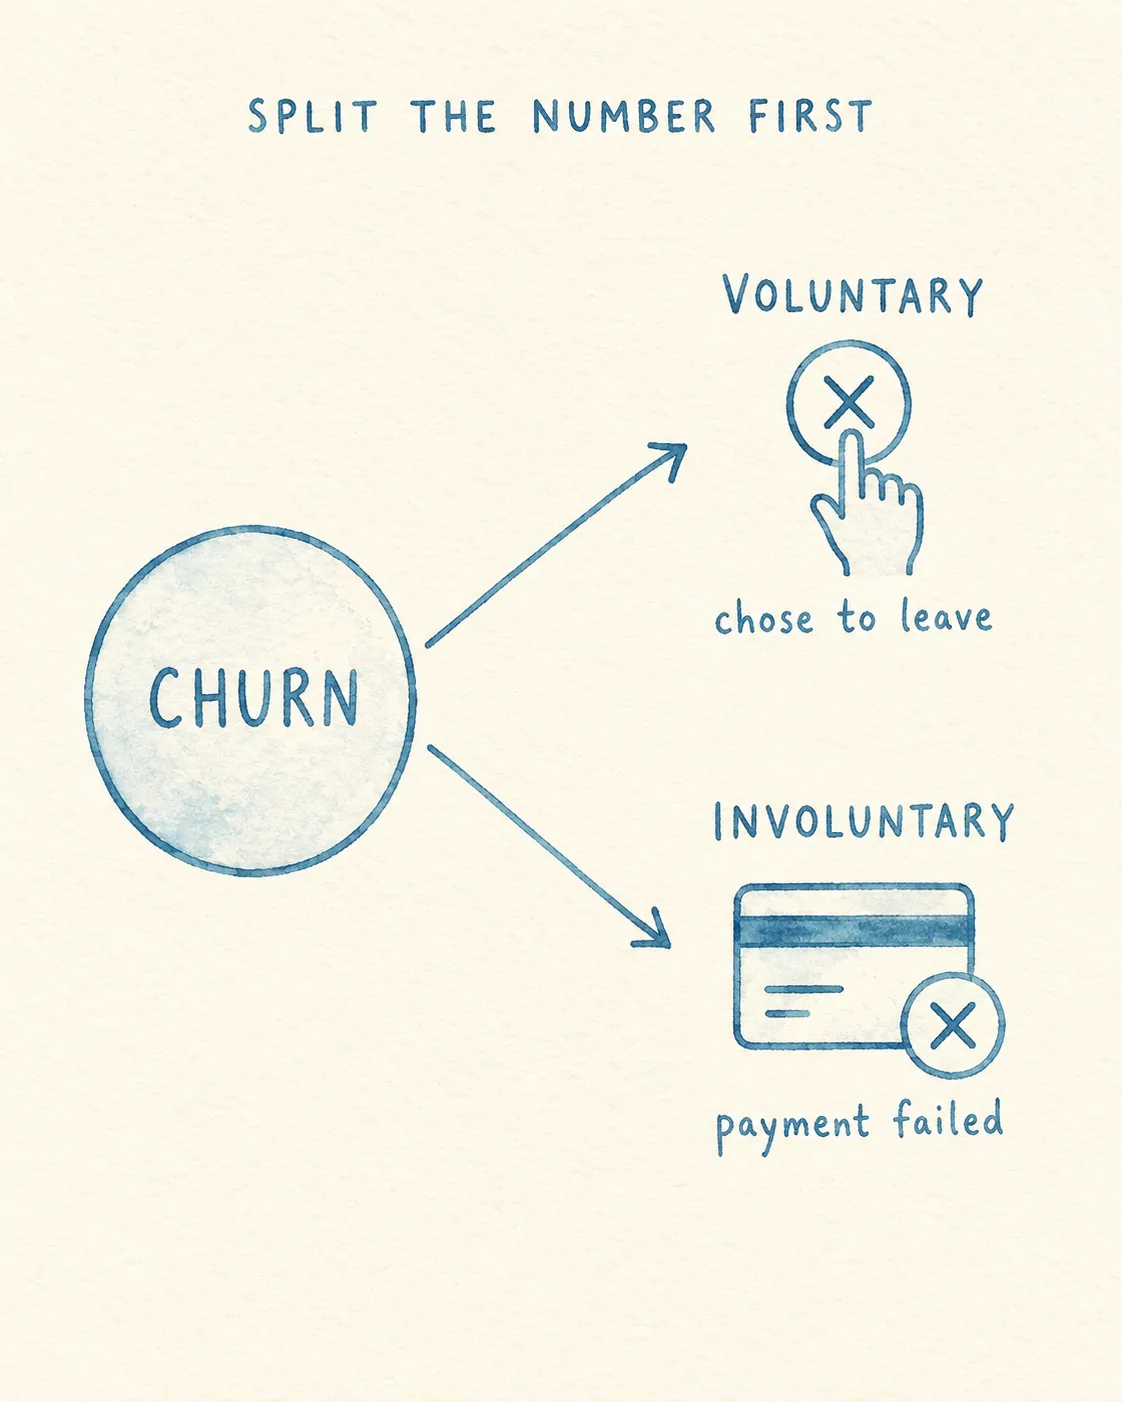
| Churn type | What happened | Where the fix lives |
|---|---|---|
| Voluntary | The subscriber cancelled before the next renewal | Product value, onboarding, plan fit, pricing, cancel experience |
| Involuntary | A renewal payment failed and was never recovered | Billing retry, grace period behavior, payment update prompts, recovery messaging |
Keeping these two apart is the most important habit in churn analysis. A cancellation survey cannot explain a card failure that the subscriber never saw. A dunning email cannot win back someone who cancelled because the app never became part of their routine. When the two are blended into one churn number, both fixes get aimed at the wrong people.
If the failed-payment side looks large, work it as its own system: retry behavior, grace period, and how subscribers update payment. The failed payment recovery guide covers those states in detail.
What data do you need?
You need three kinds of data for each lost subscriber: what happened, who they were, and why it happened. Miss one and the analysis stalls.
| Data group | What to capture | Why it matters |
|---|---|---|
| Subscription events | Cancel, expiry, renewal success, renewal failure, billing retry outcome | Separates choice from payment failure and shows what recovery already saved |
| Segment labels | Cohort month, acquisition source, plan and price, lifecycle stage | Shows where the loss concentrates instead of averaging it away |
| Reasons and context | Cancellation reason, survey answer, support contact, product use before leaving | Connects the event to something the team can change |
A few notes on getting this right:
Segment by cohort first. Subscribers who joined in the same month share the same onboarding, pricing, and early experience, so a weak cohort can point at a specific change. Then cut by plan, since monthly and annual subscribers leave for different reasons and on different timelines. Then cut by lifecycle stage: trial, first renewal, early months, and long term tenure. Early loss may point at onboarding and first value. Later loss may point at habit, pricing, or a competing option.
Connect product use to the subscription event. The billing platform knows the transaction. Product analytics knows what the subscriber did before leaving. Support knows what confused them. One source on its own makes every problem look like its own shape. Together they show the path from last meaningful use to the cancel tap or the failed charge.
Refix connects product, subscription, and support signals so a team can investigate a churn number without stitching exports together by hand.
How do you read cancellation reasons?
Apple reports cancellation reasons in App Store Connect, and the labels are narrower than many teams expect. Read the cancellation reasons reference alongside your own survey data so the two are not confused.
| Apple report reason | What it describes |
|---|---|
| Billing Issue | A renewal that failed to collect, which belongs with payment recovery rather than a save offer |
| Price Increase Notice | Loss connected to a notified price change |
| Price Increase Consent | Loss connected to a price change that needed explicit agreement |
| Canceled | Subscriber-initiated cancels, including the answers from any in-app cancel survey |
| Removed From Sale | Loss connected to an app or product that is no longer offered |
| Other | Loss that does not fit the categories above |
Two distinctions do most of the work here. First, survey answers sit under Canceled. They describe only the subscribers who chose to cancel and chose to answer, which is a slice of voluntary churn, not the full picture. Second, Billing Issue is failed-payment recovery, not a save offer audience. Sending a discount to an expired card fixes nothing until the payment method is updated.
For the voluntary side, pair the report with your own reading: which survey answers repeat, which lifecycle stage they come from, and what support tickets arrived in the same period. The cancellation reasons guide walks through that separation in full.
Churn is only one input into whether revenue is holding. If expansion is offsetting the losses you find here, that shows up in net retention rate. For the dollar-weighted version of the same question, read revenue churn.
Turning analysis into action
Analysis earns its keep when each finding points to one owner and one change. Group what you found by the fix it needs, not by the chart it came from.
A simple way to sort the work:
- Onboarding and first value findings go to the team that owns the first week. Check whether new subscribers reach the outcome they paid for before the first renewal.
- Plan fit findings go to whoever owns packaging and pricing. Look at whether subscribers sit on the plan that matches how they actually use the app.
- Cancel experience findings go to the team that owns the retention path. Review what a cancelling subscriber sees and whether the reason they give leads somewhere useful.
- Failed-payment findings go to whoever owns billing recovery. Confirm the retry, grace, and payment update path recovers subscribers who never chose to leave.
Change one thing per segment at a time so the next churn report can be read. If onboarding, pricing, and dunning all change in the same month, the number moves but nobody learns which change moved it. Rerun the same segmentation each cycle and compare the same cohorts, so a real improvement shows up where you expect it instead of hiding inside an average.
When the diagnosis is clear, use how to reduce churn to route voluntary cancellations, failed renewals, active saves, and win-back work to the right next action.
Churn analysis never ends with a single answer. It ends with a shorter list of suspects, each with an owner, and a report next month that shows whether the list got shorter.
See how Refix connects product and subscription signals.
FAQ
- What is churn analysis?
- Churn analysis is the work of finding out why subscribers left. It breaks a churn number into voluntary cancels, failed payments, cohorts, plans, and lifecycle stages so a team knows what to fix.
- What is the difference between voluntary and involuntary churn?
- Voluntary churn happens when a subscriber chooses to cancel. Involuntary churn happens when a renewal fails to collect, usually because of a payment problem. The first needs product or offer changes, the second needs billing recovery.
- What data do you need for churn analysis?
- You need the subscription event, the segment it belongs to, and the reason behind it. That means cancel and renewal events, cohort and plan labels, lifecycle stage, cancellation reasons, payment retry outcomes, and support contacts.
- How do you turn churn analysis into action?
- Group findings by the fix they need, assign one owner per group, and change one thing at a time. Voluntary cancel findings go to product and offer work, while failed-payment findings go to billing recovery.